Finance Summary
The following is for Fiscal Year End of the Year Designated: (Fiscal years end on September 30)
|
Population |
Total Expenditures |
Expenditures Per Capita |
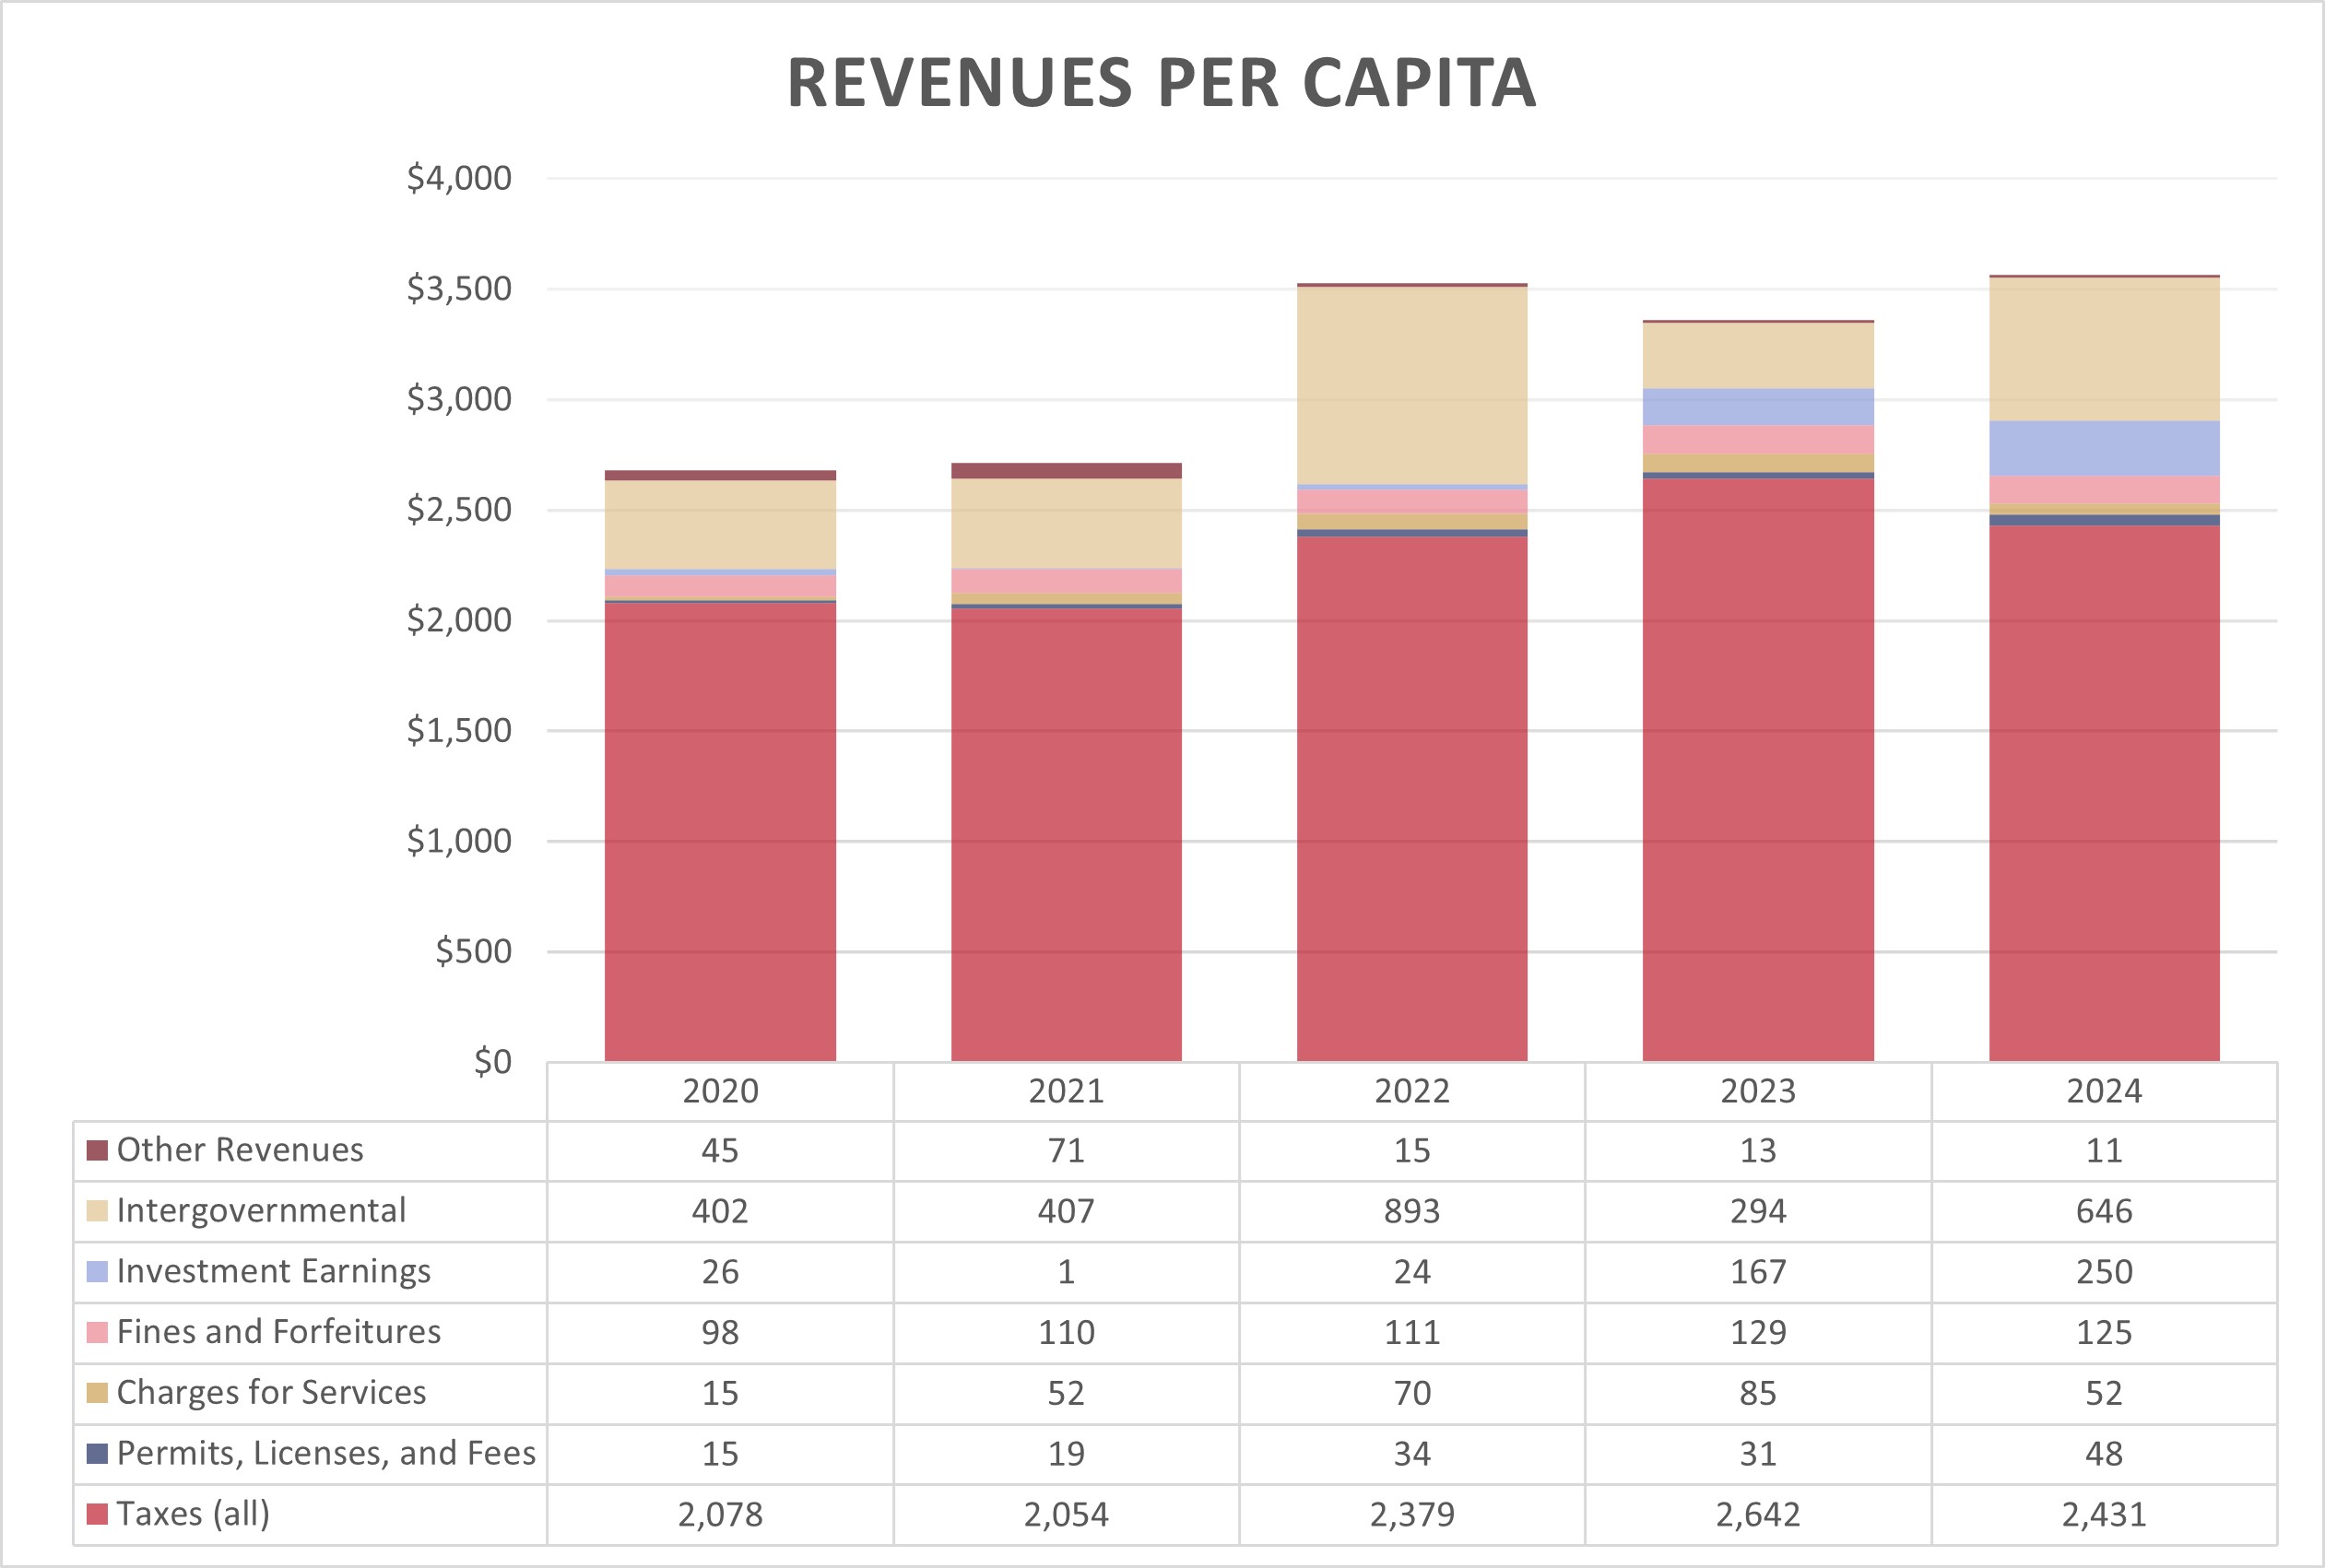
Total Revenues |
Revenue Per Capita |
| 2024 |
7,925 |
$28,238,950 |
$3,563 |
$28,238,950 |
$3,563 |
| 2023 |
7,746 |
$26,034,860 |
$3,361 |
$20,215,134 |
$2,610 |
| 2022 |
7,921 |
$27,925,930 |
$3,526 |
$21,798,475 |
$2,752 |
| 2021 |
8,074 |
$21,921,406 |
$2,715 |
$21,748,592 |
$2,694 |
| 2020 |
8,017 |
$21,482,619 |
$2,680 |
$20,569,236 |
$2,566 |
|
Population |
Property Tax Revenue |
Property Tax Revenue Per Capita |
Sales Tax Revenue* |
Sales Tax Revenue Per Capita |
| 2024 |
7,925 |
$9,605,517 |
$1,212 |
$9,057,576 |
$1,143 |
| 2023 |
7,746 |
$8,960,329 |
$1,157 |
$10,855,576 |
$1,401 |
| 2022 |
7,921 |
$7,959,835 |
$1,005 |
$10,228,443 |
$1,291 |
| 2021 |
8,074 |
$7,993,521 |
$990 |
$8,076,749 |
$1,000 |
| 2020 |
8,017 |
$7,721,108 |
$963 |
$8,323,919 |
$1,038 |
* Sales tax revenue includes Jersey Village Crime Control and Fire Protection/EMS Districts
You can find a more detailed breakdown of this information by looking at the Comprehensive Financial Report Statistical Section for the given year, which can be found above.
For the current fiscal year the city has 117 full time employees.
You can click on any image below to enlarge it.
Governmental Funds Revenues Per Capita

Governmental Funds Expenditures Per Capita

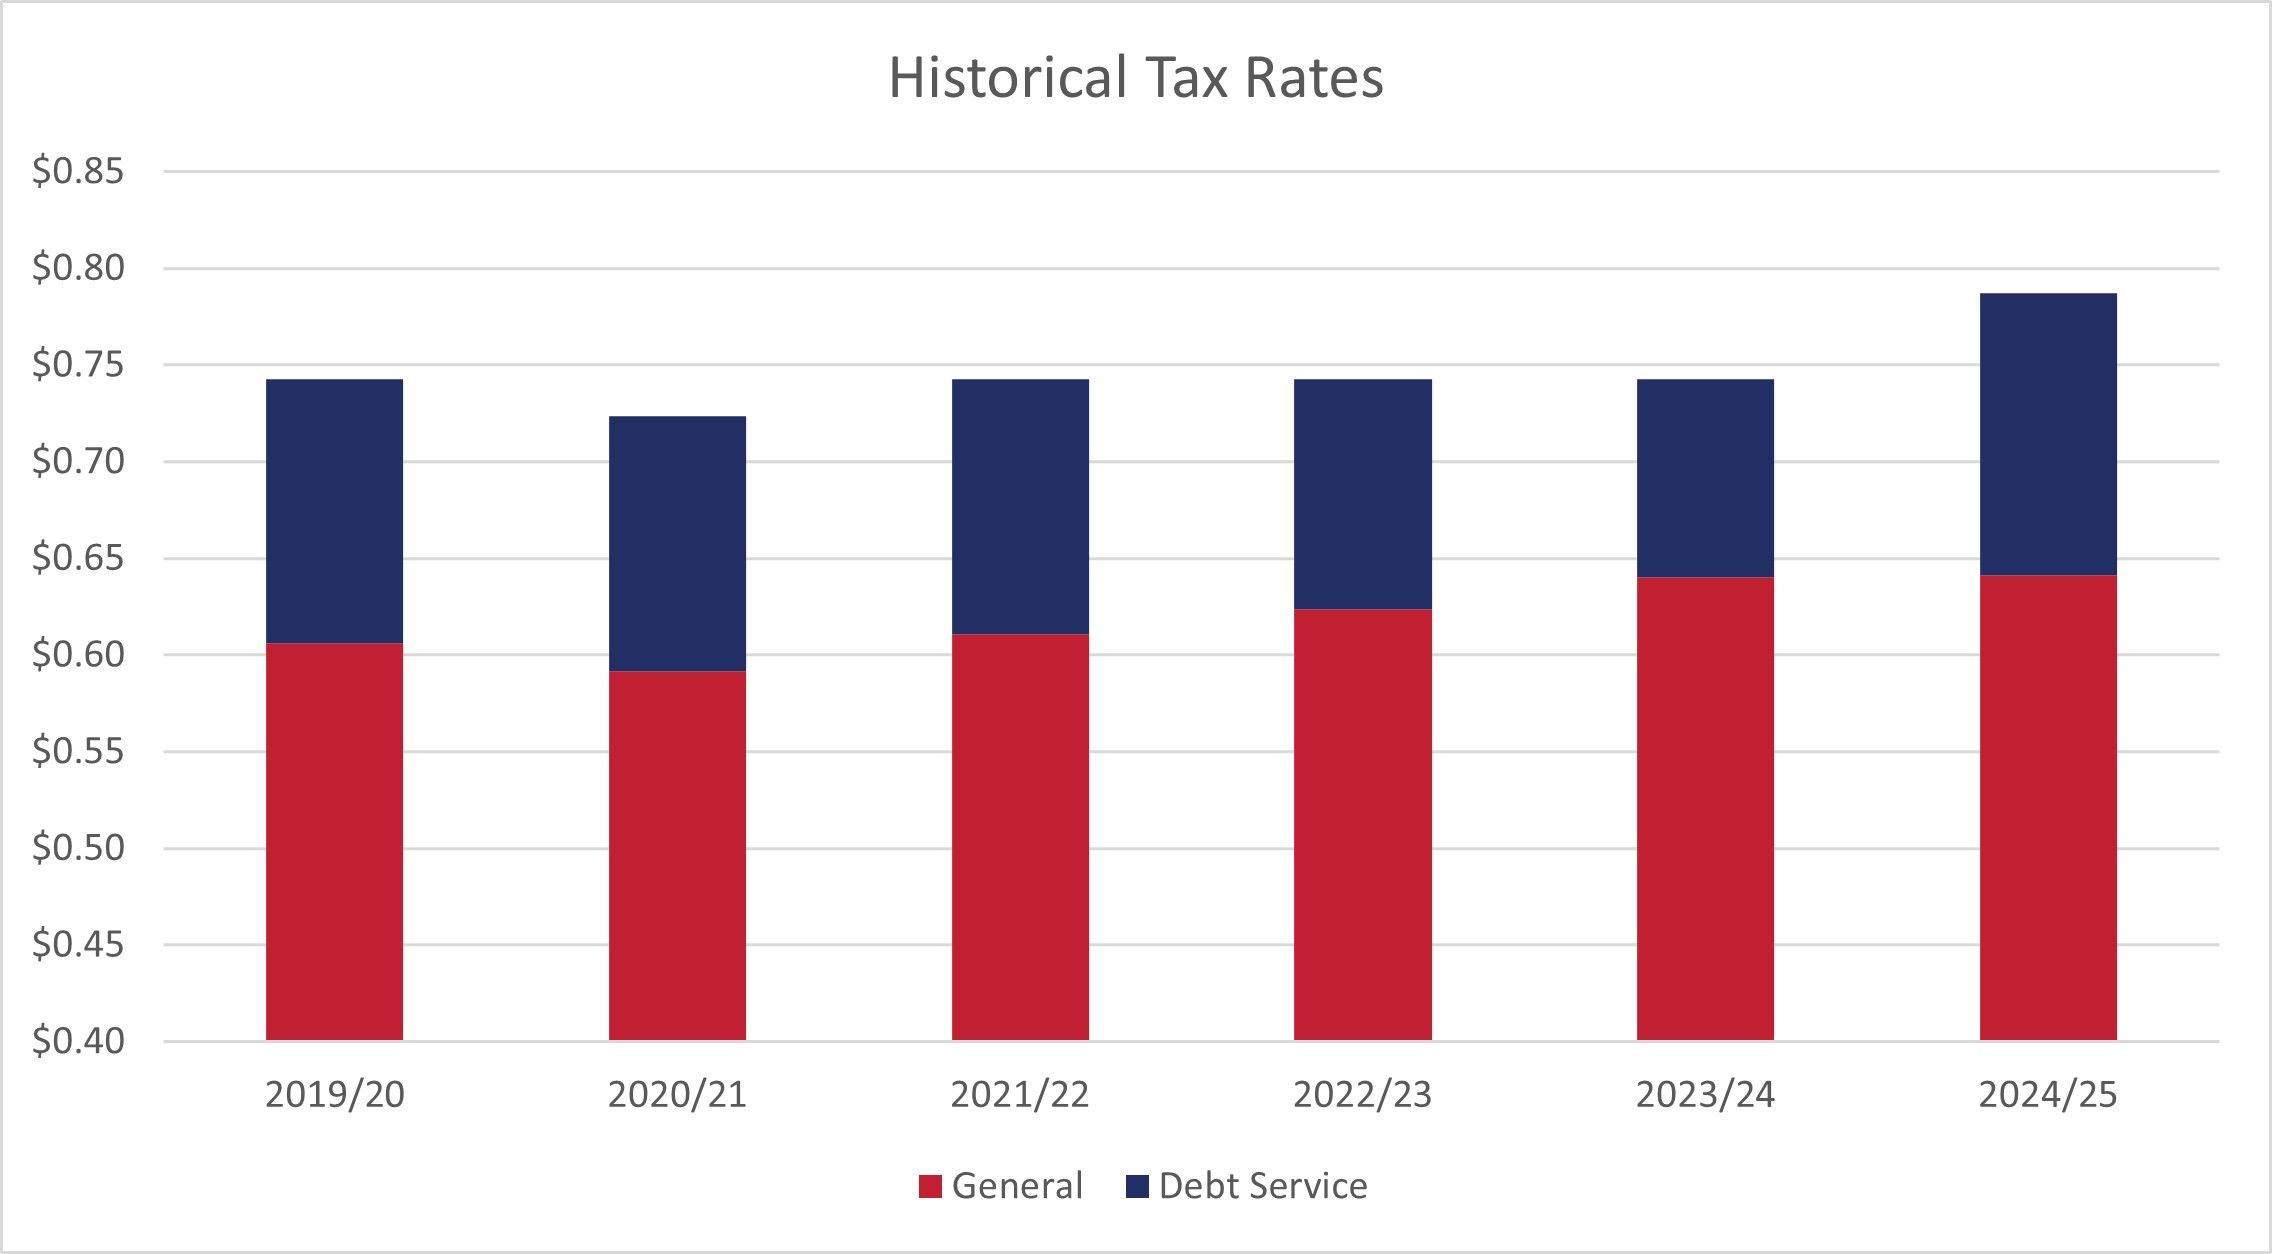
In 2007 the City set the tax rate at $0.7425 per $100 of valuation. In FY2021 it was reduced to .723466. It was moved to $0.7425 in FY2022 It was $0.7425 in FY2023.

Click here to download this data in excel format.